Quantifying Image Quality of a Positron Emission Tomography (PET) System

A study of a PET system's geometry and its impacts on image quality
By Levi Keay
The purpose of the experiment was to understand and characterize a Positron Emmission Tomography (PET) imaging system. In this write up, I provide a brief background of PET technology, describe the experimental setup and hardware used, and outline the methods used to characterized the system. You can read a reduced paper rendered in LaTex (abstract, introduction, and figures/captions) here, which I submitted as a component of my 4th year experimental physics lab.
All figures and diagrams were made by me using Python and Adobe Illustrator, as well as the data processing and collection. The signal processing hardware, stepper motors and computer interface were provided by the TA’s but minimal guidance was given in learning how to set up the experiment.
Contents:
Background on PET
Experiment setup
2.1. Gamma-ray detection
2.2. Processing hardware
2.3. Key system parameters and their impact on image resolution
Methods and Results:
3.1. Scanning a single radiation source in one dimension.
3.2. Quantifying the Signal-to-Noise-Ratio (SNR) of the system.
3.3. Imaging two radiation sources with two degrees of freedom.
1. Background on PET
Positron Emission tomography (PET) is an imaging modality which uses beta-positive decay of a radiation sample as its imaging energy source. This decay is well suited to its purpose because it produces two photons which are emitted in opposing directions, due to the conservation of energy when a positron and electron annihilate inside the radiation source. The characteristic along-axis emission of beta-positive decay provides the geometric information which essential to image reconstruction from the scan data; two opposing detectors are used and when they detect photons simultaneously, it is known that the source of emission lies somewhere along the line between them. Though the point of emmission along this line in 3D space is unknown, by scanning from a multitude of angles and thus building a collection of lines-of-emmission, an image of the distribution of radiation can be made by using an inverse radon transform. In medical PET systems, multiple angles of detection are achieved by having a ring of detectors surrounding the imaging area.
2. Experiment Setup
2.1. Gamma-ray detection
In the present experiment, the set-up consitutes just two detectors, directly opposing each other as shown in the photographs below. Either 1 or 2 radioactive samples can then be placed in the “arm” of the device, and the arm is capable of being programmed to move along the track in one dimension, and rotate in the horizontal plane. This simulates a ring-detector set up, though one scan takes longer as the arm must be held in position at each angle, rather than taking all measurements at once. These 2 degrees of freedom enable me to generate a 2 dimensional image via the inverse radon transform.
The detectors used are photomultiplier tubes (PMTs). As their name implies, they amplify a low powered radiation signal into a larger, more manageable signal. Their engineering is quite interesting, but I will let the link above serve as the explanation and continue to focus on the experiment at hand.
1-2 radiation sources can be housed in the imaging arm, which is moved along the track and\or rotated in incremental steps using automated step-motors interfacing with the lab computer. The arm is held in place at each step while coincident photon emmisions deteted by the PMT pair are counted. A record of the photon count, track position and angle at each step is recorded onto the lab computer.
 |  |
|---|---|
| The 2 two opposing photomultiplier tube detector setup | Close up of the imaging area, the sample arm, and the adjustable copper aperture gates |
2.2 Processing hardware
The signals from the PMTs then travel through the hardware bank shown below, from right to left. The key processing steps are :
1) Amplification
Further increase the signal amplitude
2) Single channel analyzer
Determine if the pulse is characteristic of the targeted radiation emmission
3) Universal coincedence
Determine if two signals occur within a sufficiently short time window to be considered from the same decay event.
4) Counter
Count the number of coincident photons detected by both channels at the given scanning position
 |
|---|
| Hardware modules used to process the signal coming from the PMTs |
2.3. Key system parameters and their impact on image resolution
Parameters of the experiment with major implications on scan/image quality include:
- Linear step size (mm)
- Rotational step size (degrees)
- Exposure time per step (s)
- Aperture (mm)
Linear and rotational step sizes influence spatial resolution of the formed image, while exposure time will influence the radiometric resolution, or contrast, of the final image. The aperture effects image sharpness, by controlling image blur that arises due to the permiability of the copper aperture gates and the geometry of the imaging area.
The diagram below demonstrates the geometry of the imaging aparatus and the impact of aperture width on image blur for a single radiation source. This arises due to the semipermeability of copper to gamma photons.

The possible paths of photon emission from an anisotropic radioactive source resulting in coincident scintillator activation are shown. Green areas represent lines of response in which both linearly opposing photons pass through the open aperture of the devices with probability \({P_{open}}^2 = 1\), while the red regions represent the lines of response in which both photons pass through the semi transparent copper shielding with probability \({P_{copper}}^2\). When the source is not directly in the center of the imaging area, a third regime occurs in which one photon passes through the open aperture while the other penetrates the copper with the multplied probability \({P_{open}}\cdot{P_{copper}} = {P_{copper}}\). The theoretical coincidence count rate as a function of the source position is determined by the sum of the areas on a unit circle multiplied by their corresponding probabilities of coincidence detection.
3. Methods and Results
3.1. Linear scanning of a single radiation source
To begin, a single radiation source was imaged by moving it along track in 1 dimension. This step is mainly to garner insight into how varying the parameters of exposure time and aperture effects the scan.

Coincident photon counts from a single Na-22 radiation source measured for varying distance from the center of the imaging apparatus perpendicular to the axis of the detector pair. The distance range of 15mm was covered in increments of 0.2mm and the source was held stationary for 100 seconds at each increment. The mean of 5 trials is plotted with error bars representing one standard deviation from the mean for each position. The aperture for this run was 3mm, which is distinguishable in the data as the full width of the primary signal (ie, the steeply sloped regime between -1.5mm and 1.5mm). The primary signal contains information beneficial to image reconstruction, while the tails outside of it contribute to the background noise. The characterization of the noise signal and its use in isolating the primary signal is crucial to the measurement of the signal-to-noise ratio (SNR) of the scanning system.
Observing the shape of the scan function shown above, it is clear at which point along the track the radiation source enters the “primary” imaging area (ie, the region of track where the green area would appear as shown in the diagram above, due to the source being directly between the open aperture). This primary imaging area is represented in the scan as the steeply sloped regime, while the flatter “tails” of the scan represent noise arising from the permiability of the copper aperture gates.
In order to characterize the SNR of the system, a measurement of the background signal amplitude to the primary signal amplitude can be made by fitting both signals with a gaussian curve:

Coincident co-linear photon count data generated from an Na-22 radiation source is shown for three scans using varying aperture widths a. The noise signal is interpolated as a Gaussian fit to the outer tails, shown as the solid lines in (a). The isolated primary signals are fit using a separate Gaussian function (b). The primary signals are separated by first segmenting the data using the bottom-up break-point detection algorithm applied to the first spatial derivative, which then allows for the noise-signal Gaussian function to be fit to the tails of the data. This serves as an interpolation of the noise signal within the primary signal range. The primary signal is then isolated by taking the region of the data lying between the tail segments and subtracting the noise-signal Gaussian function. As expected, the distributions from trials with wider apertures are less localized and larger in amplitude due to a larger detector area being available to the source as it moves through the imaging plane.
3.2. Quantifying the Signal-to-Noise-Ratio (SNR) of the system.
Measurements of the primary and noise signals in this method of gaussian fitting allows for qualities of the system such as SNR and image blur to be quantitatively measured, as shown in the diagram below:

Signal attributes relevant for image reconstruction quality are shown as a function of aperture as determined by experiment using an Na-22 radiation source scanned in the linear horizontal plane perpendicular to a scintillator detector pair. Full-width-at-half-maximum (FWHM) of the primary signal (a) is a measure of blurring, while the relative strength of the primary and noise signals (b) give signal-to-noise ratio (SNR) (c) which determines the contrast of the radiation source to it’s back ground in the reconstructed image. Error bars in (a) represent one standard deviation in the standard deviation of the Gaussian fitting function. Error in the calculation of signal peaks are carried through from error in the scaling factor of the fit of Gaussian functions to the primary signals, and they too small to be shown in the plots. When selecting an aperture, a trade-off exists in image quality between blurring and SNR. The selection of an appropriate aperture value depends on the spatial dimensions of the target, the activity and localization of the radiation source, and the spatial resolution of the scan as determined by the translatory and rotational step sizes.
3.3. Imaging two radiation sources with two degrees of freedom
Scan profiles of two source imaging at different angles look like this:
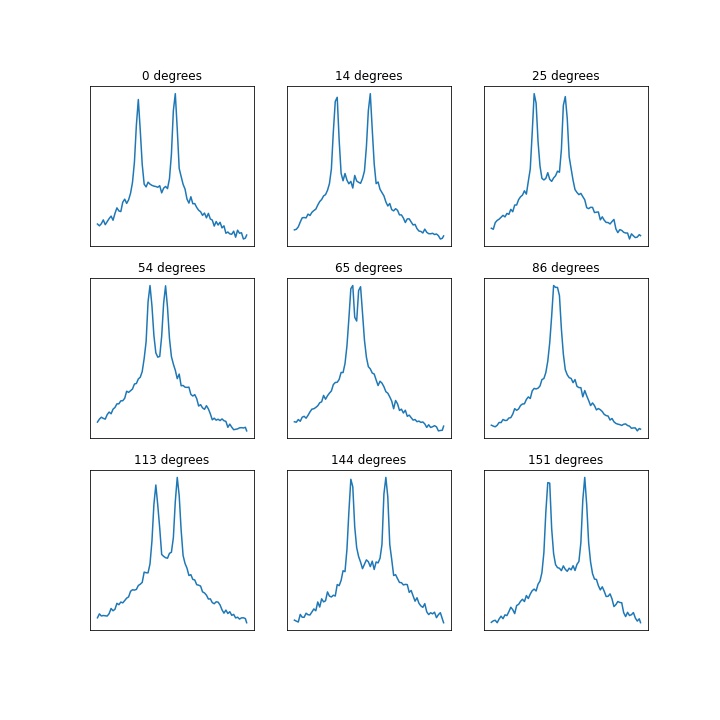
A sample of nine projection angles from a scan of two side-by-side Na-22 radiation sources is shown. A total of 50 projections spaced evenly over 180 degrees were taken in the scan. At 0 degrees, the two sources are at maximum separation, and at 90 degrees they are at minimum separation as seen from the detector pair axis.
In order to reconstruct an image, scans were taken at 50 distinct angles, and a sinogram was constructed. The sinogram represents the scan using a colour map, where brighter pixels represent higher photon counts. The columns of the sinogram represent varying scan angles, while the rows represent lateral movement through the PET system. The 2 dimensional image of the radiation distribution was then retrieved from the sinogram by means of the inverse radon transform.

Sinogram (left) and reconstructed image (right) displaying crescent shaped distortion of two radiation sources. Axis labels show row and column count. In the sinogram this is the linear and angular step intervals, respectively, while in the reconstructed image they show arbitrary/unconverted units of distance. See the following figure for equivalent converted scale and proper labeling.
The crescent shape of the radiation sources is suspect as their shape is known to be small and spherical. It was determined that the crescent shape was an artifact arising due to the poor alignment of the sinogram. The sinogram should be centered about the axis of rotation. Sinogram centering was approximated by deleting peripheral rows at the bottom of the sinogram, which resulted in improved localization in the transformed image:

The sinogram (a) and the reconstructed image by inverse radon transform (b) for a PET scan of two side-by-side Na-22 radiation sources. The precise size and shape of the sources is unknown but estimated to be roughly spherical with diameters of 2-5 mm. The scan covered 180 degrees of rotation at a step angle of 3.6 degrees, giving a total of 50 projections. For each projection, the source arm was moved laterally through the imaging area, covering a total distance of 23mm with a step size of 0.4mm, and being held stationary for 100 seconds at each step. Each column of the sinogram (a) represents the projection obtained from one imaging angle. The reconstructed image is well resolved as the two sources are distinguishable and the region of activity is constrained to a few mm, which is comparable to the physical size of the radiation sources (b). The data was manually aligned such that the tomography rotation axis aligned with the midpoint of the sinogram.
The issue of sinogram alignment is traced back to the alignment of the imaging apparatus. In this experiment with the express purpose of system calibration, it is permissible to perform this kind of post-acquisition alignment of the data. However, in an applied PET scan scenario where the radiation source distribution may not be known, this kind of a posteriori centering would not be possible, and good care would have to be taken to align the scan equipment -namely, the PMTs and imaging track- before a reliable scan could be obtained.